Microerosion analysis
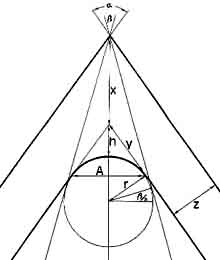 Figure 4. Diagram depicting the laws of wane formation in a simplified fashion.
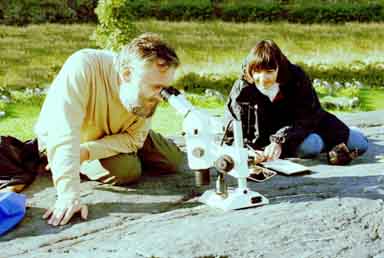 Figure 5. Microerosion analysis of petroglyphs on Rupe Magna, Valtellina, Italy.
 |
The rationale of microerosion analysis is that, after a new rock surface has been created, by either natural or anthropic agents, it is subjected to chemical weathering processes. This applies especially in unsheltered locations, and it results in cumulative effects that are a function of time, among other factors. While this is a fairly self-evident principle, the difficulty in using the results of such processes to estimate the age of a rock surface is that our understanding of them, of their effectiveness on different rock types, and of their susceptibility to environmental factors remains limited. We know that rock surfaces retreat with time, be it by solution (Acker and Bricker 1992; Busenberg and Clemency 1976; Lin and Clemency 1981; Oxburgh et al. 1994; Rimstidt and Barnes 1980; Williamson and Rimstidt 1994), physical wear, or a combination of the two. Empirical engineering data for natural building stone tells us that the amount of retreat differs greatly according to rock type (Schwegler 1995). Macroscopic rock erosion ranges up to fifty millimetres each one thousand years for poorly cemented sandstone, but can be as little as fifty microns on the non-quartz components of granite. This process of weathering is surface retreat (e.g. by granular exfoliation) and has sometimes been called ‘micro erosion’ (two words), although its products are certainly visible at the macroscopic level (Smith 1978) (see below under ‘pitfalls’).
The term ‘microerosion’ (one word, unhyphenated) refers exclusively to solution processes whose effects can be seen only at the microscopic level. Hence, for the timespans we are concerned with in dating petroglyphs, only comparatively erosion-resistant rock types are of interest. In most cases this excludes especially sedimentary rocks. It must also be emphasised that microerosion analysis is not one specific method, but a cluster of possible methods around a basic concept. Two have so far been applied practically: the measurement of micro-wanes on fractured crystals (Bednarik 1992, 1993), and the selective, often alveolar retreat in certain rock types of components that weather at vastly different rates (Bednarik 1995a). The effectiveness of the second approach has been confirmed by Pope (2000) when he tried to negate it. Pope effectively failed to appreciate the difference between these two approaches, perceiving microerosion analysis as a muddled combination of the two. There is no doubt that various alternative indices of micro-erosion may also prove to be useful, but, so far, their potential remains unexplored.
Macro-wanes on rock are the results of progressive rounding of freshly broken rock edges. Cernohouz and Solc (1966) claimed to be able to estimate the ages of such wanes to within 10-20% accuracy on two rock types. After observing similar rounding at the microscopic scale, on individual mineral crystals that had been fractured, it occurred to me that these phenomena were likely to obey the same physical laws. I explained these fundamental laws geometrically and mathematically (Bednarik 1992, 1993), which made it possible to attempt dating by measuring wane sizes. These formulae explained how, under ideal conditions, wane development is related to time. (They explain also many other things in nature, for instance the geometry determining the course of temperature transfer within a solid object, the geometry explaining how a solid body melts, or how a liquid penetrates a porous body.)
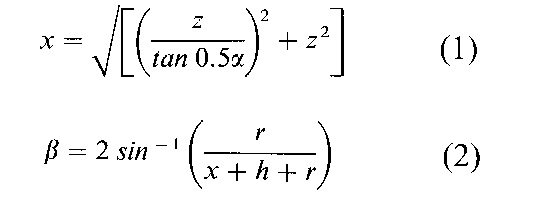
The ‘radius’ of rock wanes (strictly speaking, wanes are not equicircular in section, but hyperbolic), at whatever magnitude of size, increases as a function of age. In wane formation (Figure 4), the ratio h : r is constant for any angle alpha, irrespective of distance of retreat of the faces and the edge. Ratio x : z is a function of alpha, and at alpha = 60 degrees, x = 2z. Dimension x can be expressed in algebraic fashion as per Formula 1 above.
This leads to the prediction of beta, the angle expressing the rate of wane development relative to surface retreat (Formula 2 above).
The relationship wane width A with age, irrespective of actual retreat, is ultimately determined by the ratio alpha : beta, which must be established empirically. It follows that the dimensions A, r, z, and angles alpha and beta are all related geometrically and algebraically, and that the variables A, r, x, z and h are all proportionally equivalent, and increase linearly with age. Of these, A is most easily measured physically. It is therefore the variable used in micro-wane measurement. The analyst scans the rock surface microscopically to locate crystals that have been truncated (either fractured by impact or truncated by abrasion) by the event to be dated (e.g. the petroglyph production). A statistically significant sample of micro-wane widths along the edges of such truncation surfaces is recorded for a selected angle, and placed in a calibration curve. Age estimates are prefixed with a capital E, indicating that the result is erosion derived.
Until we know much more about solution rates of common and suitable component minerals, we need to establish these rates regionally with calibration curves. In microerosion analysis, the use of two (or more) curves for two (or more) different component minerals is recommended. Since it is unlikely that different minerals would all react similarly to past environmental changes, one would expect to detect irregularities because the corresponding values of a sample would appear displaced in the calibration graph’s ordinates. If solution of one component mineral had slowed down or accelerated sufficiently to render the distortion detectable by such a comparatively coarse method, it would be reflected in the misalignment of the corresponding points on the curve. No other dating method currently used in archaeology offers such a self-checking mechanism.
The precision of the method is probably poor at this early stage, because it depends entirely on the number and precision of calibration points. The principal potential variables in microerosion are temperature, pH and moisture availability. The first two are regarded as unimportant: variations in mean temperatures were probably minor, even as far back as glacial peaks of the Pleistocene; they would not have affected solution rates appreciably. Variations in pH would certainly apply back through time, but in the case of both amorphous silica and quartz, there is almost no change in solubility below pH 9. For alumina it is negligible in the central region of the pH scale, which coincides with most natural conditions. Quartz, then, can serve as a control against which to check the effects of pH changes on other minerals (Rimstidt and Barnes 1980).
There is no doubt that precipitation would have varied at any site in the past, and it varies between different sites today. However, it is expected that significant changes in moisture availability would affect component minerals differently, and should thus be detectable by calibration. In this respect, the unknown sample – the surface to be dated – provides one of the points one can use to check reliability of the calibration curves, because its multi-mineral values, too, must lie on the same ordinate in the diagram.
The microerosion method by micro-wane measurement has been used on petroglyphs in six blind tests now, in Russia, Portugal, Italy and Bolivia (Bednarik 1992, 1993, 1995a, 1997b, 2000b, 2002). Archaeological expectations were matched in all cases except one, where, however, results matched those of other scientific analyses (Bednarik 1995b; Watchman 1995). Calibration curves are now available from Lake Onega (Russia), Vila Real (Portugal), Grosio (Italy), Um Sanaman (Saudi Arabia) and the eastern Pilbara (Australia), and the technique has also been applied in India, China (Tang 2000) and South Africa. The method has a practical time range from the present to perhaps 50 000 years BP, which renders it particularly suitable for rock art. Results ranging from a few hundred years to thirty millennia have so far been obtained (Figure 5).
While microerosion analysis is not thought to provide great accuracy, it is probably more reliable than most alternative methods of dating petroglyphs, and it is certainly cheaper and simpler than most. It requires no laboratory backing; the results can be determined in the field. It provides not a single result, but clusters of age-related values (the micro-wane widths) that can be converted into various statistical expressions – a luxury that nearly all other dating methods have to do without (OSL on individual mineral grains and multiple targeted applications of AMS 14C to the same lamination might be broadly comparable). Importantly, it does not attempt to determine the age of some accretion or other feature somehow relatable to the rock art, it focuses on the age of the actual petroglyph, the ‘target event’ of Dunnell and Redhead (1988). No other method currently available does this. Microerosion analysis does satisfy the demand of Dunnell and Readhead for methods that are applicable directly to the feature about which chronological information is sought. Moreover, it is the only dating method that offers a means of internal checking, that is, of checking the validity of the result without recourse to another method (although again luminescence dating has a limited feature of this type, i.e. the possibility of checking whether the uranium and thorium decay chains are in equilibrium). Finally, microerosion analysis involves no removal of samples, or even contact with the rock art, being a purely optical method.
The valid arguments against microerosion analysis are that we have inadequate calibration curves for it, that its accuracy is inherently limited, that it can only be applied to certain rock types (principally those comprising crystalline quartz, until quartz-free rock types are calibrated), and that it is unsuitable where the rock surface may not have been continuously exposed to precipitation (i.e. where it may have been concealed in the past by sediment, mineral accretion etc.). An objection raised by (Dorn 2001: 171) is that there are different types of crystalline quartz, and only the weathering of alpha-quartz is well understood. However, until significant differences in solution rates are demonstrated, this should not detract from the method’s utility in providing broad estimates of age. Dorn also fears that pre-existing weathering might be present in samples, which is a valid objection only where deep fractures truncated crystalline quartz veins and exposed them to water flow. I have described such an instance from one of the Penascosa panels in Portugal, which suggests that his fear is unfounded because such prior exposure is identifiable. Nevertheless, it is correct that there are significant inherent limitations in microerosion analysis, which have been emphasised in all publications about it, but these limitations are out-weighed by the benefits of this method.
Perhaps the most telling example of its versatility is its recent use to date not petroglyphs, but the tools used in their production. This is an alternative application with indirect implications for rock art dating, but one of great promise. Quartz was frequently used as the material of petroglyph hammers, and in such cases where these tools remained on the surface, exposed to weathering, their fractured edges (or those on tiny spalls detached during their use) certainly lend themselves to microerosion analysis. This method has so far been used at only two sites, Kalatrancani 3 and Toro Muerto, both in central Bolivia (Bednarik 1998b: 32).
Rock art dating – back to main page
References list for rock art dating